Truc Pham
  • home
  • projects
  • blog
  • cartography
  • publications
  • CV
  • get in touch!
    • LinkedIn
    • ORCID
    • email
    • GitHub
Categories
All (1)
class project (1)
flood risk (1)
green space (1)
map (1)
Poland (1)
QGIS (1)
Warsaw (1)

cartography

Maps and spatial data work with R and QGIS: what each piece shows, how I made it, and what it taught me.

I came to cartography from environmental impact assessment, where every report starts with a location map and a baseline. This page is where I practise in the open: making maps, and the R work behind them — finding and cleaning spatial data, joining it to environmental indicators, and turning it into figures that answer a question. Small pieces first, more ambitious ones as my R and QGIS skills grow.

Tools: R (sf, terra, tmap, ggplot2, dplyr) · QGIS · open data (OpenStreetMap, Copernicus, GUS, Eurostat GISCO)

NoteWhere this is going
  1. Foundations — clean location and baseline maps, the kind every ESIA needs.
  2. Climate & environment — land surface temperature, green space and land cover for Warsaw and Polish cities.
  3. Carbon — mapping and quantifying emissions and carbon storage in soil and vegetation.
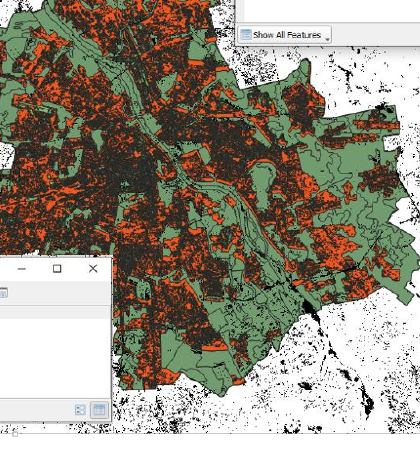
Green space, impervious surfaces and flood risk: Warsaw and Powiśle in QGIS
map
QGIS
Warsaw
Poland
flood risk
green space
class project

Exercises from my GIS course at the University of Warsaw: four environmental indicators for Warsaw and Powiśle, and the buildings inside Powiśle’s 500-year flood zone.

Jun 3, 2025
No matching items

© 2026 Truc Pham


This website is built with GitHub, R, and Quarto